
Cryptocurrency News
Ripple [XRP] Price Prediction, Technical Analysis – August 18

Ripple XRP the 3rd largest cryptocurrency by market capitalization is currently trading at $0.317205 at the time of writing this post as per Coinmarketcap. The 24h High is $0.373619 and 24h Low is $0.31213.
Yesterday on 17th of August it was on a bullish move but today it seems that the bullish move is over as it is on a downward move.
Ripple Price Prediction and Technical Analysis
The 10-day Exponential Moving Average is $0.32217 while 20-day EMA is $0.35162 which indicates that the bullish move is still to be achieved. As seeing the EMA data, it suggests selling.
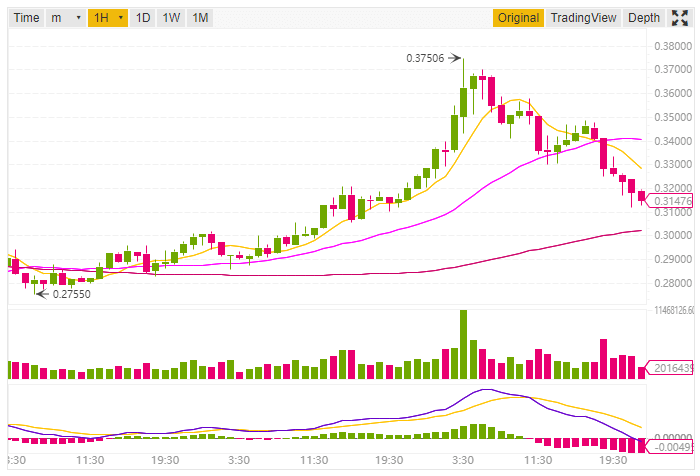
Ripple Price Prediction and Technical Analysis 18th August (Binance)
But if we see at the 10-day simple moving average ($0.30574) which indicate a buy signal. The 50-day EMA is $0.41722 which is also a sell signal.
The Relative Strength Index period 14 is level 40 which indicates that the price is in the neutral zone. MACD Level (12, 27) is -0.03922 which is below the zero line.
On the 1 hour chart, the 10-day and 20-day EMA are $0.32781 and $0.33173 respectively which indicates that the price is decreasing. Also the MACD 12, 27 is below zero line which indicates a sell signal.
This article should not be considered as an investment advice. Please conduct your own research before investing in any cryptocurrency.
Disclaimer: Koinalert’s content is only for information purpose in nature and should not be considered as investment advice. Do your own market research before investing in any cryptocurrencies. The author or publication does not hold any responsibility for your personal financial loss.


![Dogecoin [DOGE] Price Analysis Before and After Elon Musk SNL Tweet](https://www.koinalert.com/wp-content/uploads/2021/05/Dogecoin-price-analysis-after-Elon-Musk-SNL-tweet-400x240.jpg)
![Dogecoin [DOGE] Price Analysis Before and After Elon Musk SNL Tweet](https://www.koinalert.com/wp-content/uploads/2021/05/Dogecoin-price-analysis-after-Elon-Musk-SNL-tweet-80x80.jpg)


Coinbase to List Pyth Network (PYTH) on Solana: Trading Begins February 20, 2025

Canary Capital Launches Canary AXL Trust, Expanding Institutional Access to Blockchain Connectivity

Argentina’s President Milei Faces Backlash Over $LIBRA Token Crash

FTX to Begin Creditor Repayments in February 2025
