Ripple XRP seems to have taken a long jump. The 3rd largest cryptocurrency by market capitalization is currently trading at $0.446425 USD (+6.56%). At the time of writing this post, the market capitalization of Ripple XRP is $17,855,954,932 USD.
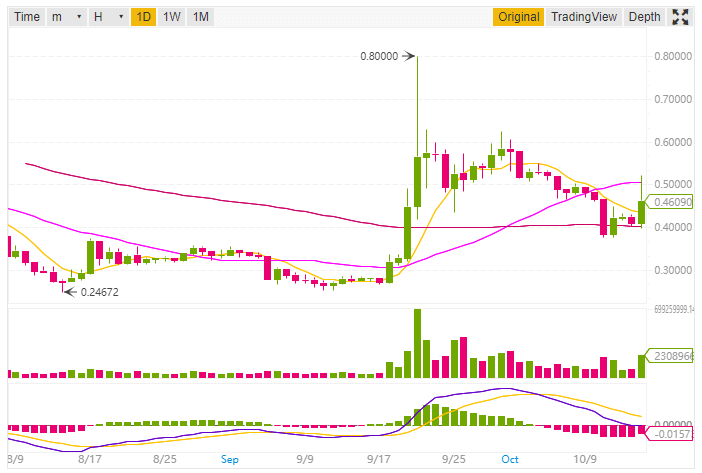
Today Ripple XRP has broken the 100-day Exponential Moving Average which is 0.44506. Sometimes ago it was trading below $0.40 and has made a resistance level between $0.40 – $0.42.
Ripple Price Analysis
Today Ripple XRP has broken the 100-day EMA which was 0.44506 and SMA (100). It was trading at $0.55 on 01st of this month against USD trading pair.

Data as per Binance
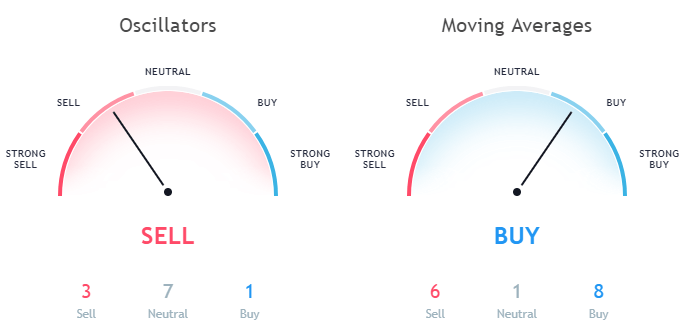
However, the current price of XRP is below the 200-day EMA i.e. it is yet to broke the EMA (200) and SMA (200). The EMA (200) for XRP is 0.50530 while the SMA (200) is 0.51946. While looking at the other EMA and SMA most of them are indicating towards a buy signal.
The Volume Weighted Moving Average (20) is 0.50584 which is indicating a sell signal. Also while looking at the Hull Moving Average (9) it is 0.41207 and is in the buy zone.
The above analysis was based on the daily moving averages of Ripple XRP and now let’s have a look at the Oscillators.

Data as per TradingView
While looking at the oscillators the daily Relative Strength Index (14) is in the neutral zone with a value of 50.63934. The MACD Level (12, 27) is -0.00089 is in the sell zone. If we look at the Bull Bear Power it is 0.00742 and is in the neutral zone.
The daily Average Directional Index (14) is 26.92991 and depicting a buy signal. After looking at all the oscillators the final indication is towards a sell signal.
Conclusion
Looking at the charts, moving averages and oscillators of Ripple it can be concluded that XRP is going to support at $0.44. However, as per the bullish move, there are chances that the price of Ripple XRP will go up to $0.47.
This article should not be considered as an investment advice. Please conduct your own research before investing in any cryptocurrency.

