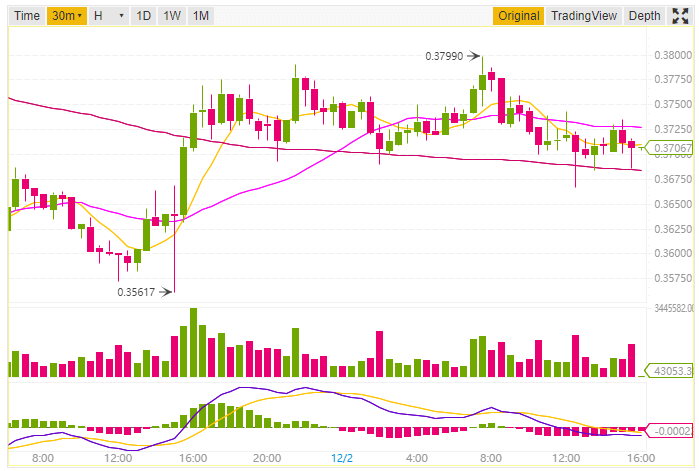
Ripple XRP currently being the 2nd largest cryptocurrency in terms of Market Capitalization $14,848,961,103 USD. At the time of writing this article, the price of XRP is $0.368211 USD (+0.49%). The 24h traded volume is just $400,844,305 USD.
Ripple is currently supporting the price of $0.37 until it supports this price it will be trading in the range of $0.36 – $0.38
Ripple XRP/USD Price Analysis
We will do the price analysis based on the technical details like Moving averages and Oscillators. As we look at the daily Exponential Moving Average (5) and the Simple Moving Average (5) both are towards a sell-off zone.
The daily EMA(10) and SMA(10) which is 0.38948 and 0.38002 respectively. Both of these EMA(10) and SMA(10) is also towards a sell-off zone.
While looking at the Ichimoku Cloud Base Line (9, 26, 52, 26) which is 0.44222 is in the neutral zone. The Volume Weighted Moving Average (20) is also in the sell zone.

Ripple XRP Price Chart by Binance
Let’s have a look at the Oscillators, the daily Relative Strength Index (14) is 36.67609 and the Ultimate Oscillator (7, 14, 28) is 48.00772. Both are in the neutral zone. The daily MACD Level (12, 26) is -0.03001 which is towards a sell zone.
So daily moving averages is indicating towards a massive sell zone while the oscillators are in the neutral zone.
Prediction (Short to Medium term):-
But while looking at the hourly moving averages and oscillators like EMA(5, 10, 20, 30, 50, 100), SMA(5, 10, 20, 30, 50, 100), RSI, MACD Level. Here hourly moving averages are in sell pressure while oscillators are in the buying zone. Ripple XRP have to break this support level in order to have a boost in their price.
This article should not be considered as an investment advice. Please conduct your own research before investing in any cryptocurrency.

