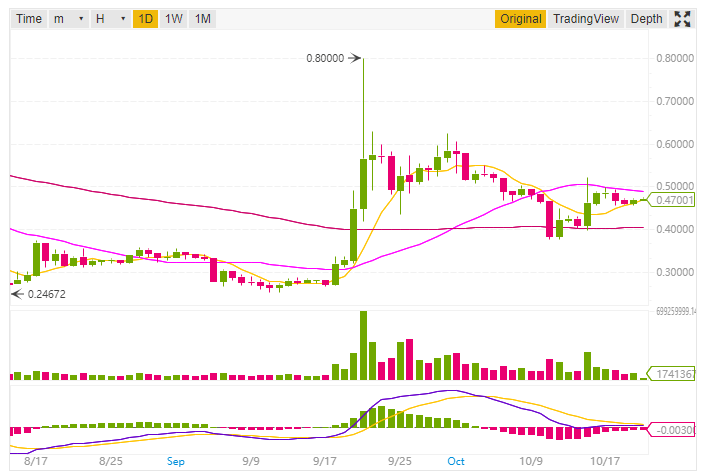
Ripple XRP/USD seems that it is trying hard to recover from the downward trend. Yesterday it was below the daily EMA (20) but today it has broken the zone and now it’s in the buy zone.
However, the daily EMA (200) having the value of 0.50338 is still to be achieved. Ripple is currently resisting near $0.46 – $0.47. At this time Ripple is not in a mood for a bullish move.
The daily Ichimoku Cloud Base Line (9, 26, 52, 26) which is currently in the neutral zone is trying to get out of the oversold zone.

Data as per Binance
However, the daily Volume Weighted Moving Average (20) somehow has recovered from the oversold zone to the buying zone. The daily Hull Moving Average (9) which is in the sell zone having a value of 0.47173.
While coming at the Oscillators the daily Relative Strength Index (14) is now in the neutral zone. The RSI is currently between the buying and selling pressure but has recovered from the oversold zone.
The daily MACD Level (12, 27) is currently in the selling pressure zone. The MACD Level will soon be in the buying zone as the histogram is tending towards zero.
Daily Stochastic RSI Fast (3, 3, 14, 14) is 82.08190 and the Williams Percent Range (14) is in the neutral zone trying hard to gain. The Stochastic %K (14, 3, 3) having a value of 60.06792 is currently between the buying zone and oversold zone.
Conclusion
Looking at the moving averages and oscillators of Ripple it can be concluded that XRP/USD is going to support at $0.46. As per the current trend of the market, it’s showing a mixed signal. However, you can trade it for long-term as Ripple XRP/USD will increase in the coming future.
This article should not be considered as an investment advice. Please conduct your own research before investing in any cryptocurrency.

