
Tron Price Prediction and Technical Analysis
Tron TRX currently the 13th largest cryptocurrency by market capitalization. It is currently trading at $0.022475 USD (-5.12%) as per Coinmarketcap at the time of writing this post.
Tron is trading up 16.30% from the previous week. The market capitalization for TRON cryptocurrency while writing this post is $1,477,670,745 USD and 24h trading volume is $121,217,501 USD.
Today TRON is on a massive Bearish move, not only this all other cryptocurrencies are in bearish move. Here I will do the analysis in two parts first one will be on the basis of the 1-day price forecast while the other one will be on 1h price forecast.
1-day Price Forecast
The 10-day Exponential Moving Average for Tron TRX is 0.02183847 while the 10-day Simple Moving Average is 0.02124349. Both of the above EMA (10) and SMA (10) is indicating a buy signal. Let’s have a look at the other EMA and SMA in order to better clarify the trends.
Data as per Binance
The EMA (20, 30) is 0.02156312 and 0.02203071 respectively. Here EMA (20, 30) is towards a buy signal, while EMA (50, 100) is indicating a sell signal. Also, the SMA (20, 30) for TRX is 0.02045813 and 0.02203446 respectively. All these SMA (20, 30) for the 1-day price forecast is indicating a strong buy signal.
Data as per TradingView
But while looking at the Oscillators, the MACD Level (12, 27) is -0.00010329 indicating a buy signal. The Relative Strength Index (14) is 51.85371400 which is in the Neutral zone.
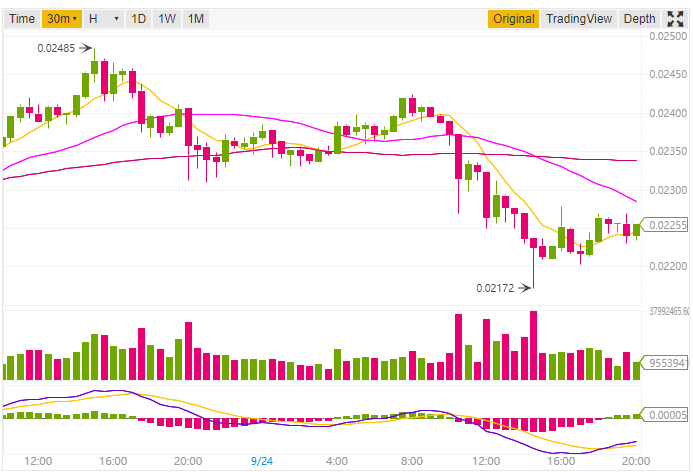
1h Price Forecast
Now let’s have a look at the 1h price forecast. The Exponential Moving Average (10) for Tron TRX is 0.02258809 while the Simple Moving Average (10) is 0.02243832. EMA (10) is indicating a sell signal while SMA (10) is indicating a buy signal.
Data as per TradingView
Also, the other EMA like EMA (20, 30, 50, 100) is towards a sell signal. Similar is the case with the SMA (20, 30, 50, 100).
Even if we look at the Oscillators for 1h price forecast the Relative Strength Index (14) is 38.17053200 which is in the neutral zone. The MACD Level (12, 27) is in the sell zone with a value of -0.00032095.
As per the analysis based on the different moving averages, graphs and Oscillators Tron TRX will take some time for a bullish move. However, you can HODL it as the price of Tron TRX is too low now.
This article should not be considered as an investment advice. Please conduct your own research before investing in any cryptocurrency.
Coinbase has announced its plans to add support for Pyth Network (PYTH) on the Solana…
Canary Capital, a leading digital asset-focused investment firm, has announced the launch of the Canary…
In a recent and rapidly unfolding controversy, Argentine President Javier Milei has come under intense…
After more than two years of legal proceedings following its dramatic collapse, cryptocurrency exchange FTX…
The Indian government has introduced stringent tax regulations targeting undisclosed cryptocurrency gains, imposing penalties of…
El Salvador made history in September 2021 by becoming the first country in the world…
This website uses cookies.


